
Overview:
Increase qualified admissions traffic during the fall recruitment window by coordinating email marketing, paid social ads, and event-driven communications. The goal was to generate predictable, measurable spikes in engagement that aligned with key moments in the admissions cycle (Open Houses, Luncheon reminders, and major SGS events).
Strategy:
Paid social ads launched during key admissions moments to reach new audiences and retarget engaged families.
Event-driven emails (Quarterly Newsletter, Luncheon Save-the-Date, Open House reminders) created predictable spikes in web activity.
UTM tracking ensured we could follow each campaign from impression → click → landing page → Ravenna action.
By coordinating timing rather than sending everything at once, SGS saw clear, trackable momentum across the fall season.
Results:
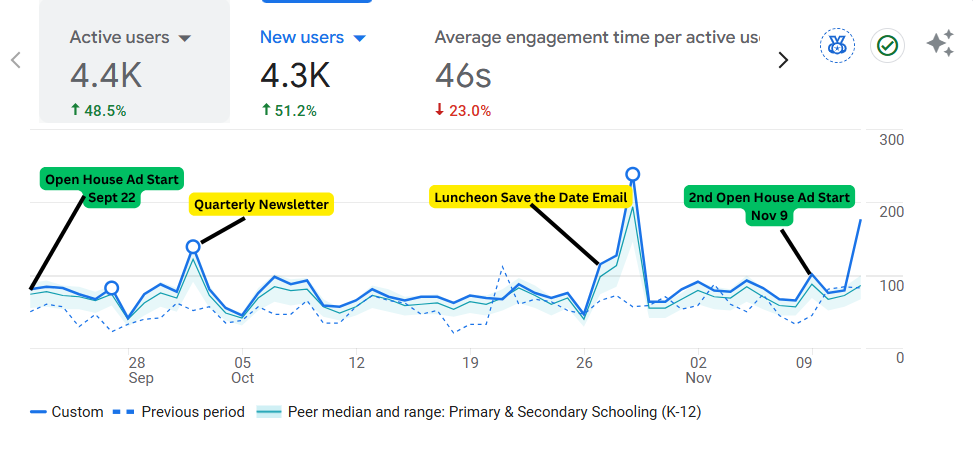
48.5% increase in active users during the September–November campaign window.
Clear traffic lifts following each staggered communication, including:
Open House ads (Sept 22)
Quarterly Newsletter (Oct 3)
Luncheon Save the Date (Oct 27)
Second Open House ad push (Nov 8)
Engagement time per user remained strong, and UTMs showed increased clicks to key admissions pages, including “Visit,” “Apply,” and the Open House landing page.
My Role:
Built a multi-week admissions campaign calendar based on historical traffic trends
Designed and wrote all email marketing pieces
Created paid social ads to support admissions pushes
Implemented full UTM tagging for Ravenna and SGS landing pages
Monitored GA4 daily and adjusted timing based on behavior patterns
Updated admissions content to support conversions
Case study: multi-channel traffic strategy
Admissions season marketing window
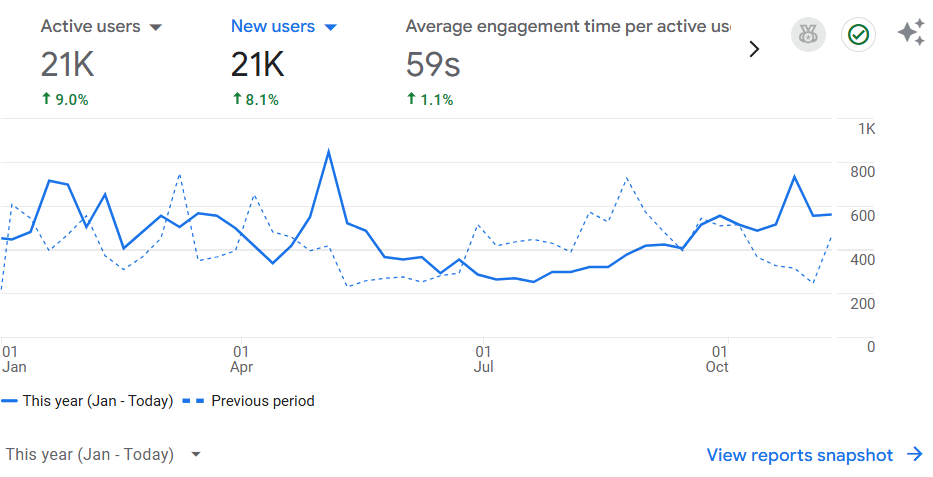
Eleven-month website traffic data